This is a continuation of my previous post, where I time boxed myself and only got through chart 1a. Here I want to finish the rest of the predictions and run the remaining charts.
Recap
Same setup as before:
- Model:
Qwen2.5-7B-Instruct - Hardware:
NVIDIA A40 - vLLM: prefix caching on, chunked prefill on, max batched tokens
2048, FlashAttention 2, KV cache22.99 GiB(430,528tokens)
Numbers from last time that I’ll keep reusing:
- KV bytes per token:
57,344 bytes/token - Weight bytes per decode step:
14.14 GB - Bytes moved per decode step:
14,000,000,000 + 57,344 * B * T - FLOPs per decode step:
B * (1.4e10 + 4.0e5 * T) - A40 ridge point:
~215 FLOP/byte
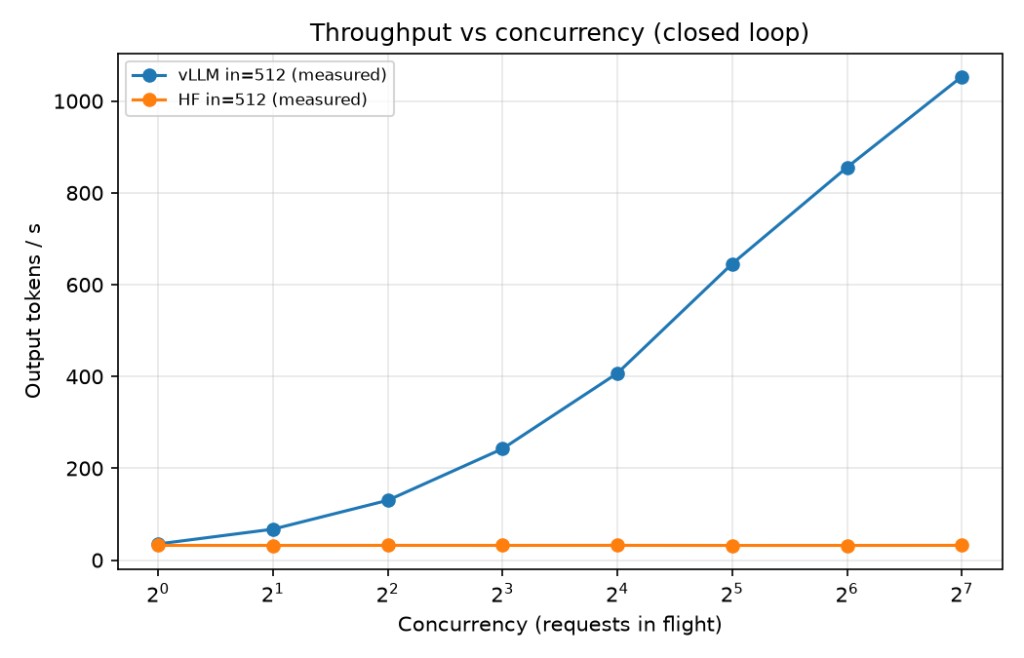
And from chart 1a, at C = 1 vLLM and the HF baseline were very close, so per-step overhead r is roughly 1.
What’s left
- 1b) concurrency vs decode throughput with 8192 input tokens
-
- latency vs throughput
-
- concurrency vs TPOT and concurrency vs TTFT
-
- prompt length vs TTFT
So before making predictions, I’m going to correct some values using the chart 1a measurement, so the next few passes are less of guesses and potentially more accurate.
At C = 1 in the 512-in / 128-out sweep, TPOT was 28 ms. At concurrency 1, that average is basically the decode step time. Each of those steps has to stream the model weights:
weight bytes/decode

~= 14.14 GB
Decode is memory-bound here (operational intensity is ~1 FLOP/byte vs the A40 ridge of ~215), and KV-cache traffic is tiny next to the weights (57,344 * 512 ~= 29 MB). So the step is dominated by reading those 14.14 GB. Implied memory bandwidth:
14.14 GB / 28 ms ~= 505 GB/sThe A40 datasheet peak is 696 GB/s, so this is about 73% of peak. That is a pretty reasonable achieved bandwidth; kernels do not hit the datasheet number in practice. I’ll use 505 GB/s as the effective bandwidth for later predictions instead of 696.
We’re going to do a similar thing for prefill. Prefill is compute-bound, so this time the useful comparison is FLOPs vs TTFT vs the A40’s peak tensor-core rate (149.7 TFLOP/s).
Start from calculation 5 in the previous post, decode FLOPs at B = 1:
FLOPs/decode
= 28*((2*3584^2 + 2*3584*512 + 2*3584*512 + 2*3584^2)
    + 28*T*(128 + 128)
    + 28*T*(128 + 128))
  + 28*(2*3584*18944 + 2*3584*18944 + 2*3584*18944)
  + 2*3584*152064
~= 1.4e10 + 4.0e5 * T
Split that into pieces, because prefill is not exactly just a bunch of decode steps:
linear_per_token   = 28*(2*3584^2 + 2*3584*512 + 2*3584*512 + 2*3584^2)
                   + 28*(2*3584*18944 * 3)
                   = 13,050,576,896
                   ~= 1.305e10

attention_at_len(t) = 28 * (28*t*(128 + 128) + 28*t*(128 + 128))
                    ~= 4.01e5 * t

lm_head             = 2*3584*152064
                    = 1,090,314,752
                    ~= 1.09e9
The 1.4e10 decode constant was linear_per_token + lm_head. For prefill we only apply the LM head once, on the last prompt token, to get the first output logits. The rest is: every prompt token pays the linear/MLP cost, and token i attends to i keys (causal). Let L be the prompt length, and keep T as the decode-step context length from above. At B = 1:
FLOPs_prefill(L)
= L * linear_per_token
  + sum_{i=1..L} attention_at_len(i)
  + lm_head
= 1.305e10 * L
  + 4.01e5 * L*(L+1)/2
  + 1.09e9
~= 2.01e5 * L^2 + 1.305e10 * L + 1.09e9
For the 512-input sweep (same C = 1 run as the 28 ms TPOT):
FLOPs_prefill(L=512)
= 4.01e5 * 512 * 513 / 2 + 1.305e10 * 512 + 1.09e9
~= 6.74e12
At peak 149.7 TFLOP/s, that is a 6.74e12 / 149.7e12 ~= 45 ms lower bound on TTFT. Just moving the 14.14 GB of weights at the datasheet 696 GB/s is already ~20 ms.
Operational intensity is 6.74e12 FLOPs / 14.14 GB ~= 476 FLOP/byte. That is above the A40 ridge of ~215, so this is on the compute side of the roofline, but only by about 2x. That is not “way” compute-bound. If compute and memory overlap perfectly, TTFT would sit on the 45 ms compute time and the GPU would never sit idle waiting on weights. If they do not overlap at all, you add them: 45 + 20 ~= 65 ms. Getting the no-idle version at only 2x the ridge would be a pretty crazy kernel/runtime win; I would not assume that. Attention is only about 0.8% of the 512-token prefill anyway; the linear layers dominate.
Achieved TFLOP/s at C = 1
Measured TTFT for that same 512-token prefill:
- vLLM:
88 ms - HF:
98 ms
achieved TFLOP/s = FLOPs_prefill(L=512) / TTFT

vLLM: 6.74e12 / 0.088 ~= 76.6 TFLOP/s   (51% of 149.7)
HF:   6.74e12 / 0.098 ~= 68.8 TFLOP/s   (46% of 149.7)
So we are getting about half of peak tensor-core throughput. The measured 88 ms is also past the no-overlap roofline of ~65 ms, so some of that gap is idle time, launch overhead, and non-matmul work, not just “we failed to hit 149.7 TFLOP/s on the math.” Using the 505 GB/s we actually saw on decode, the weight read alone is ~28 ms, which is already a third of TTFT. I’ll use ~76.6 TFLOP/s as the compute rate for later vLLM predictions, but I am not going to pretend prefill fully hides memory.
These numbers are probably less trustworthy when the concurrency gets high since the KV cache grows and actually matters in the time calculations.
Predictions
Concurrency vs decode throughput (8192 input tokens, 128 output tokens) and TTFT
Start with C = 1, where there is no batching difference.
Prefill / TTFT. Prefill is compute-bound, so time is FLOPs over the rates we backed out at L = 512:
FLOPs_prefill(L) ~= 2.01e5 * L^2 + 1.305e10 * L + 1.09e9
FLOPs_prefill(8192) ~= 1.20e14

HF:    1.20e14 / 68.8e12 ~= 1.74 s
vLLM:  1.20e14 / 76.6e12 ~= 1.57 s
vLLM will split this into 4 chunked-prefill steps (max_num_batched_tokens = 2048), so it rereads the weights 4 times. Total FLOPs are still about the same, and that extra weight traffic is small next to 1.57 s, so I am leaving the vLLM number as the FLOP estimate.
Decode / TPOT. Decode is memory-bound. At C = B = 1 I will use T = 8192 for the whole 128-token decode (it only grows to 8320). KV is finally visible next to the weights:
KV bytes at T=8192:  57,344 * 8192 ~= 0.47 GB

vLLM:  14.14 GB + 1 * 0.47 GB = 14.61 GB
HF:    14.14 GB + 3 * 0.47 GB = 15.55 GB
HF pays 3x on KV because the naive cache recopy reads the old buffer, writes a new one, then attention reads it again. vLLM only pays the attention read.
vLLM TPOT:  14.61 GB / 505 GB/s ~= 28.9 ms
HF TPOT:    15.55 GB / 505 GB/s ~= 30.8 ms
At C = 1 that is still a small gap. The 8192-token KV term is only a few percent of the 14.14 GB weight read. Chart 1 is system decode throughput (tokens/sec across all in-flight requests, excluding first tokens), so that is just 1 / TPOT:
vLLM:  1 / 0.0289 ~= 34.6 tokens/s
HF:    1 / 0.0308 ~= 32.5 tokens/s
For C >= 2 the two engines diverge. The sweep is a closed loop: the number in flight is held at exactly C. A new request arrives the instant one finishes, not “when there is space.” The loadgen does not look at the server; it only knows that its own request completed. That is a pretty bad model of real traffic, but it is what we run.
HF still runs B = 1 under a lock, so its TPOT and system decode throughput stay at the C = 1 numbers. vLLM batches, so B = C until KV capacity runs out.
Decode / TPOT and throughput, ignoring mixed batches. Keep T = 8192. HF never batches:
HF bytes/step     = 14.14 + 3 * 0.47 = 15.55 GB     (always B = 1)
HF TPOT           ~= 30.8 ms
HF decode tok/s   ~= 32.5                              (flat in C)
vLLM pays one attention KV read per sequence in the batch:
vLLM bytes/step(C) = 14.14 GB + 0.47 GB * C
vLLM TPOT(C)       = bytes/step / 505 GB/s
vLLM decode tok/s  = C / TPOT
                   = 505 * C / (14.14 + 0.47 * C)
vLLM cannot actually take C all the way to 128 here. The KV pool is 22.99 GiB / 430,528 tokens, so at T = 8192:
max C ~= 430,528 / 8192 ~= 52At that cap, decode is still memory-bound. FLOPs/decode was B * (1.4e10 + 4.0e5 * T):
FLOPs  = 52 * (1.4e10 + 4.0e5 * 8192) ~= 8.99e11
bytes  = 14.14e9 + 0.47e9 * 52         ~= 3.86e10
OI     = 8.99e11 / 3.86e10             ~= 23 FLOP/byte
23 is still way under the A40 ridge of ~215. vLLM TTFT stays at the C = 1 FLOP estimate if leftover budget is still ~2000 tokens/step.
HF is serialized. Let T_req be the time to fully finish one request once it has the lock (no queueing): prefill until the first token, then the remaining 127 decode tokens.
T_req ~= TTFT + 127 * TPOT
      ~= 1.74 + 127 * 0.0308
      ~= 5.65 s
TTFT then depends on the queue in front of that prefill. If all C clients fire at once, the asyncio.Lock (FIFO) lines them up and request k waits for k-1 completions, so that first wave averages 1.74 + (C-1)/2 * 5.65. Warmup throws that wave away: it discards the first max(C, 10) completions.
Steady state is that closed loop. For HF there is never “space” in the sense of an idle server. The moment a client’s request finishes, it sends the next one. At that instant every other client already has one request outstanding: one being served and C-2 in the queue. The new request goes to the back, so it waits for the rest of the current one plus C-2 full requests. In a lockstep FIFO rotation that is always C-1 full request times, then its own prefill. Every request waits about the same:
HF TTFT ~= (C-1) * 5.65 + 1.74C vLLM bytes TPOT tok/s HF tok/s vLLM TTFT HF TTFT
1 14.61 GB 28.9 ms 34.6 32.5 1.57 s 1.74 s
2 15.08 GB 29.9 ms 67 32.5 1.57 s 7.4 s
4 16.02 GB 31.7 ms 126 32.5 1.57 s 19 s
8 17.90 GB 35.4 ms 226 32.5 1.57 s 41 s
16 21.66 GB 42.9 ms 373 32.5 1.57 s 86 s
32 29.17 GB 57.8 ms 554 32.5 1.57 s 177 s
~52 38.6 GB 76 ms ~681 32.5 1.57 s 290 s (KV full)So under this, vLLM should climb with C while extra KV traffic slowly stretches TPOT, then flatten around C ~= 52 when the cache cannot take more sequences. HF stays a flat line at ~32.5 tok/s, but its TTFT blows up with the queue.
Okay, then I realized this is missing interference. Decode being prioritized only means decode still gets a slot. It does not mean the step stays a ~30 ms memory-bound decode. If a prefill is in the same batch, the whole forward pass is as slow as that prefill chunk, so every decode token in that step waits on it.
How vLLM actually packs a step. Decode first, then waiting prefills in arrival order. max_num_batched_tokens = 2048 is the cap for the whole batch, not per request. Two 8192-token prompts do not become two 2048-chunks in one step, and they do not split 1024/1024 either. The first waiting prefill takes the whole leftover budget; the second waits for the next iteration.
two 8192-token prefills, no decodes yet:
  step 1-4: 2048 from A each time   (B waits)
  step 5:   1 decode from A + 2047 from B
After warmup, a new request arrives because some client just finished, not because the GPU had a free slot. Below the KV cap that finisher usually frees enough blocks that the new prompt can start prefilling while the other C-1 are decoding. That mixed step is still ~2048 linear tokens, so it is basically one of the four 2048-token prefill chunks from the 8192-token prompt. Total prefill FLOPs were 1.20e14, we are using the vLLM rate 76.6 TFLOP/s from the 512-token C=1 run, and t_mix is the time for one of those four chunks (the decode tokens in the batch are a rounding error next to 2048 prefill tokens):
t_mix ~= (FLOPs_prefill(8192) / 4) / 76.6e12
      ~= (1.20e14 / 4) / 76.6e12
      ~= 0.39 s
Each of the C-1 decode sequences only gets one token out of that 0.39 s.
A 8192-token prefill is 4 of those chunks (4 * 0.39 ~= 1.57 s of GPU prefill per request). Across C completed requests that is 4C mixed steps, and those steps also produce 4C * (C-1) decode tokens. Each request still needs 127 decode tokens (128 - 1). If 4(C-1) < 127, the rest of its decode tokens are decode-only steps. If 4(C-1) >= 127 (C >= ~33), every decode token shares a step with a prefill chunk.
Chart 1 is decode throughput, running / TPOT, not decode tokens divided by wall clock. Mixed-batch interference belongs in TPOT (a decode token in a mixed step takes 0.39 s instead of ~30 ms). It does not also go in the denominator as prefill wall time.
decode-only TPOT(C) = (14.14 + 0.47 * C) / 505     # seconds, the table above

if 4(C-1) < 127:
  TPOT ~= (4(C-1) * 0.39 + (127 - 4(C-1)) * TPOT_decode_only) / 127

if C >= 33:
  TPOT ~= 0.39 s

decode tok/s ~= C / TPOT
127 * C / elapsed is a different number. elapsed includes the time a request spends prefilling, when it is not decoding, so that rate is lower and it flattens near 127 / 1.57 ~= 81 once prefill is always busy. I am not using it for this chart.
KV at ~52 is still a cap, but it is not the first thing that flattens this curve anymore; the serialized 2048-token prefill chunks are.
So why isn’t vLLM TTFT just 1.57 s every time? Mixed batches do not stretch TTFT much: the new prompt still needs four ~2048-token chunks, decode tokens in the batch are a rounding error, and 4 * 0.39 ~= 1.57 s is the same work as C=1. If this new request can start those chunks immediately, TTFT stays ~1.57 s.
It goes above 1.57 s only if it cannot start immediately:
- Another prefill already owns the leftover 2048-token budget, so this one waits for those remaining chunks.
- KV is full (
C > ~51). The closed loop still holds exactlyCoutstanding requests; it does not care how many vLLM can actually run. Only ~52 fit in KV, so the rest sit in vLLM’s waiting queue. A finished request frees blocks, and those usually go to someone already waiting, not to the client who just completed.
(1) is rare at low C. Someone else’s 8192-token prefill is 4 mixed steps. In each of those steps every already-decoding sequence gets one token, so during that whole 1.57 s each of the other C-1 sequences only advances 4 decode tokens. You need 127 decode tokens to finish, so at C = 2 you almost never complete in the middle of the other prefill. Completions start overlapping in-progress prefills once 4(C-1) is no longer tiny next to 127, i.e. higher C. Even then you are only waiting on the rest of one in-progress prefill, not a pile of queued prompts. C = 32 is still under the KV cap (~52), so there is no standing wait queue. I will keep vLLM TTFT at ~1.57 s until KV is full.
C     vLLM TPOT    tok/s    vLLM TTFT    HF tok/s   HF TTFT
1     28.9 ms       35       1.57 s       32.5       1.74 s
2     41 ms         49       1.57 s       32.5       7.4 s
4     66 ms         61       1.57 s       32.5       19 s
8     114 ms        70       1.57 s       32.5       41 s
16    207 ms        77       1.57 s       32.5       86 s
32    382 ms        84       1.57 s       32.5       177 s
~52   ~390 ms       ~130     queue        32.5       290 s
tok/s here is C / TPOT. At C = 2 that is 2 / 0.041 ~= 49, not 2 / 0.029 ~= 67, because the 41 ms already averages in the 0.39 s mixed steps. The wall-clock version (127 * C / elapsed) would have been 37 at C = 2 and would flatten near 81. That is not this chart, so the decode curve should keep rising with C / TPOT (~84 at C = 32, and higher at the KV cap if t_mix stays 0.39 s). 512-in is different: a replacement prefill is one 512-token / 88 ms step, so almost every step stays decode-only and TPOT barely moves.
Results
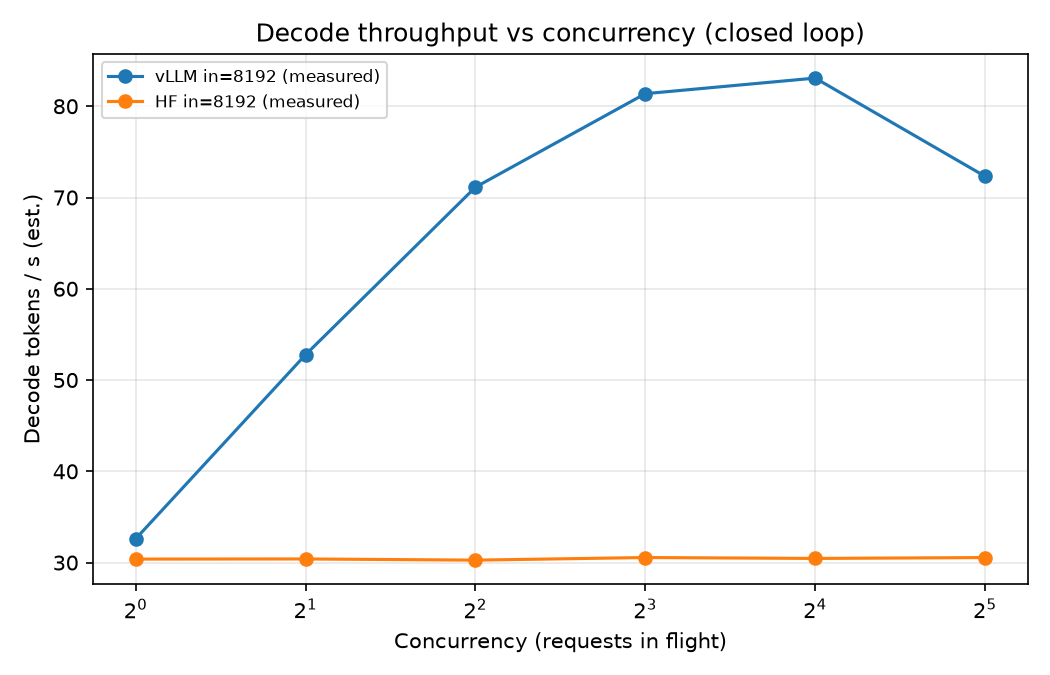
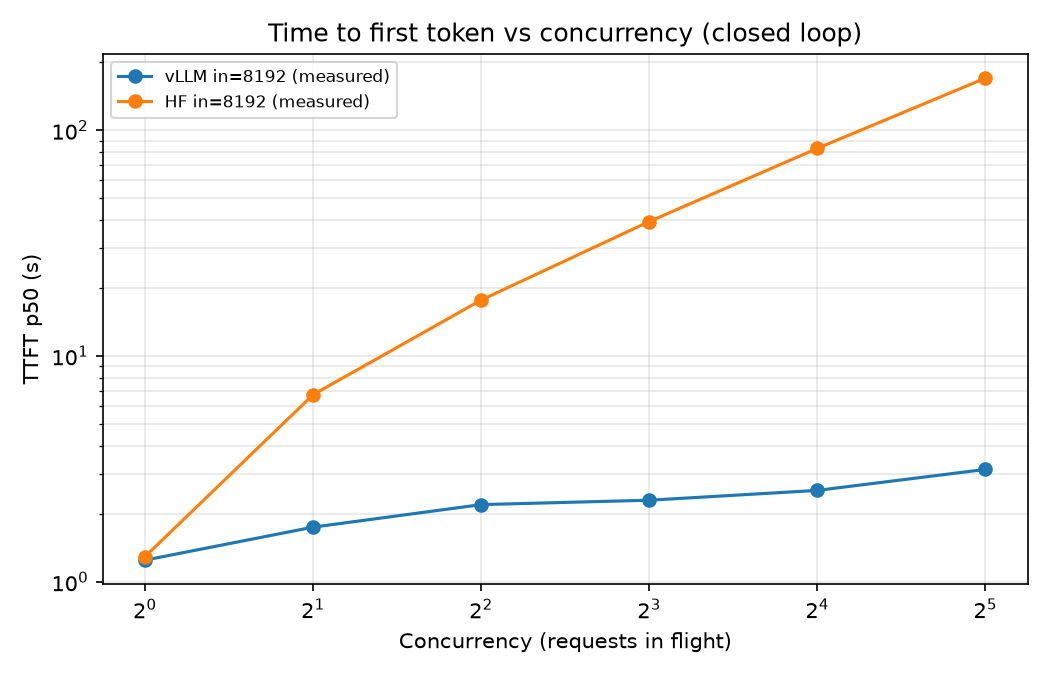
1b) Concurrency vs decode throughput (8192 input tokens, 128 output tokens)
This graph is decode throughput, prefill left out: HF is 1 / TPOT, vLLM is running / TPOT. Same metric as chart 1a and as the prediction table.
C     vLLM tok/s   HF tok/s   vLLM TTFT   HF TTFT   vLLM TPOT
1     32.61        30.38      1.25 s      1.29 s    28.8 ms
2     52.78        30.40      1.75 s      6.74 s    35.3 ms
4     71.13        30.27      2.20 s      17.7 s    51.5 ms
8     81.38        30.55      2.30 s      39.4 s    92.8 ms
16    83.08        30.45      2.54 s      83.1 s    187 ms
32    72.32        30.55      3.14 s      170 s     436 ms
vLLM waiting_mean stayed ~0 the whole sweep. C=32 is still under the KV cap. That counter misses the prefill queue: requests still wait behind whichever long prefill currently has the token budget.
HF was right. Decode throughput is a flat line at ~30.5 tok/s vs 32.5 predicted. TPOT stayed ~33 ms at every C (B = 1). TTFT is the FIFO closed loop: at C=32 I predicted 177 s and measured 170 s.
vLLM C=1 decode was right. 34.6 predicted vs 32.6 measured. TPOT 28.8 ms vs 28.9 ms from 14.61 GB / 505 GB/s. TTFT at C=1 was 1.25 s, not 1.57 s: the 76.6 TFLOP/s from the 512-token prefill was pessimistic for 8192 (1.20e14 / 1.246 ~= 96 TFLOP/s).
Decode throughput after that is C / TPOT against the chart:
C     C / TPOT     measured
1     35           32.6
2     49           52.8
4     61           71.1
8     70           81.4
16    77           83.1
32    84           72.3
C=1 is close (35 vs 33). C=2 is 49 vs 53; measured TPOT was 35 ms, where the table has 41 ms, so the mixed step was a bit faster than 0.39 s. C=4 through C=16 keep rising, same direction, but measured TPOT is lower (52, 93, 187 ms vs 66, 114, 207 ms), so the curve gets to ~83 sooner. It does not keep climbing to the ~130 at the KV cap if t_mix stays 0.39 s.
Where I was wrong. I said vLLM TTFT stays ~1.57 s below the KV cap. Measured 1.25 → 1.75 → 2.20 → 2.30 → 2.54 → 3.14 s. Requests are queued behind other prefills. One long prefill runs at a time and takes the whole leftover 2048-token budget, so the next prompt waits out the rest of those chunks. waiting_mean stays ~0 in the JSON and does not show that wait. It shows up once a completion lands mid-prefill. Those four chunks only move each other sequence by 4 tokens, and a request needs 127 to finish, so 4(C-1) is the overlap. At C=2 that is 4 tokens. At C=32 it is 124, so the next arrival almost always sits behind a prefill that is already running. The chunks themselves are a separate check. At C=4, four equal pieces of the 2.20 s TTFT would be ~0.55 s and would push TPOT near ~80 ms. It was 52 ms. At C=32, TPOT is 436 ms and decode throughput dips to 72 instead of 84.
What I got wrong
- 8192-token TTFT at C=1 was 1.25 s, not 1.57 s. The 512-token achieved TFLOP/s does not carry over once prefill is more compute-bound.
- vLLM TTFT rises with C, from 1.25 s to 3.14 s. Later prompts queue behind the one long prefill that has the token budget.
waiting_meanstays ~0 and misses that queue. Slower chunks would also have raised TPOT more than I measured (at C=4, ~80 ms vs 52 ms). - At C=32, decode throughput dipped to 72 instead of
32 / 0.382 ~= 84, because TPOT was 436 ms, not 382 ms.
Learnings from what I got wrong
The exact numbers are hard to predict without the exact implementation. Kernel choice, how a mixed step is actually launched, and how the scheduler fills a batch all move the numbers.
I still got the shape decently close, and that came from going through the scheduling and the roofline. The part I care about is what that made concrete: batching, how prefill and decode share a step, and memory versus compute. Those are the things that separate the two lines on these graphs.
vLLM TTFT rising with concurrency is that scheduling rule. One long prefill runs at a time. It holds the leftover 2048-token budget, and the next prompt queues behind it. waiting_mean stays ~0 in the results, including where TTFT is 3.14 s, so the JSON looks like the queue is empty. That field misses requests waiting on the current prefill. The TTFT column is the measurement: 1.25 s, 1.75 s, 2.20 s, 2.30 s, 2.54 s, 3.14 s. How often you hit that wait is 4(C-1) decode tokens of progress during one prefill, against 127 tokens to finish. At C=2 that is 4 tokens. At C=32 it is 124, so queueing behind the prefill already in the batch is the normal case. TPOT says the chunks did not simply get slower. At C=4, splitting 2.20 s into four chunks gives ~0.55 s each, and that would pull TPOT toward ~80 ms. It was 52 ms.
This whole thing is a bit messy, and I didn’t predict everything I set out to. I learned a lot from the predictions I did make. That left me with a better picture of how vLLM works, and of what makes inference faster or slower.
References
- Previous post: Benchmarking Hugging Face Transformers vs vLLM
- Benchmark repo results
- vLLM Documentation
- Chunked Prefill paper